

Recurring Revenue Package
Vizalytix’s Recurring Revenue Dashboard Package makes it simple to track Annual Recurring Revenue (ARR) and relationship-based metrics like Customer Retention. This template can connect directly to your company’s CRM and/or ERP systems, integrating and displaying your data in an easily digestible format for analysis.
-
![]()
ARR Trends
View ARR trends by different segments
-
![]()
ARR Changes
Highlights changes in ARR (upsell, downsell, loss, new)
-
![]()
ARR Retention
Evaluate customer retention trends over time
-
![]()
Customer Data
Comprehensive data on all customers for ad hoc analysis


Basic
For companies with experienced Tableau Developers who can perform the data integration and/or customization independently
IMMEDIATE DOWNLOAD
Consultations not included
Integration and customization not included
Standard
For companies with novice Tableau Developers that may need guidance or assistance from our team with integration
Delivery Timeframe: 2 weeks
Two 1-hour working sessions
Includes integration, no customization
Premium
For companies without Tableau Developers or bandwidth. We will handle integration and customization with your existing systems.
Delivery Timeframe: 6 weeks
30 min. weekly sync for up to 6 weeks
Includes integration & customization
This package includes the Tableau Desktop Workbook with four visual dashboard views, Tableau Prep Workflow, and Workflow Integration Documentation.
-
ARR Trends Dashboard
The first dashboard view allows the user to view ARR trends on a monthly, quarterly, or annual basis. In this view, ARR is grouped by different categories that your company uses to analyze revenue (e.g. region, segmentation, product, forecast category).
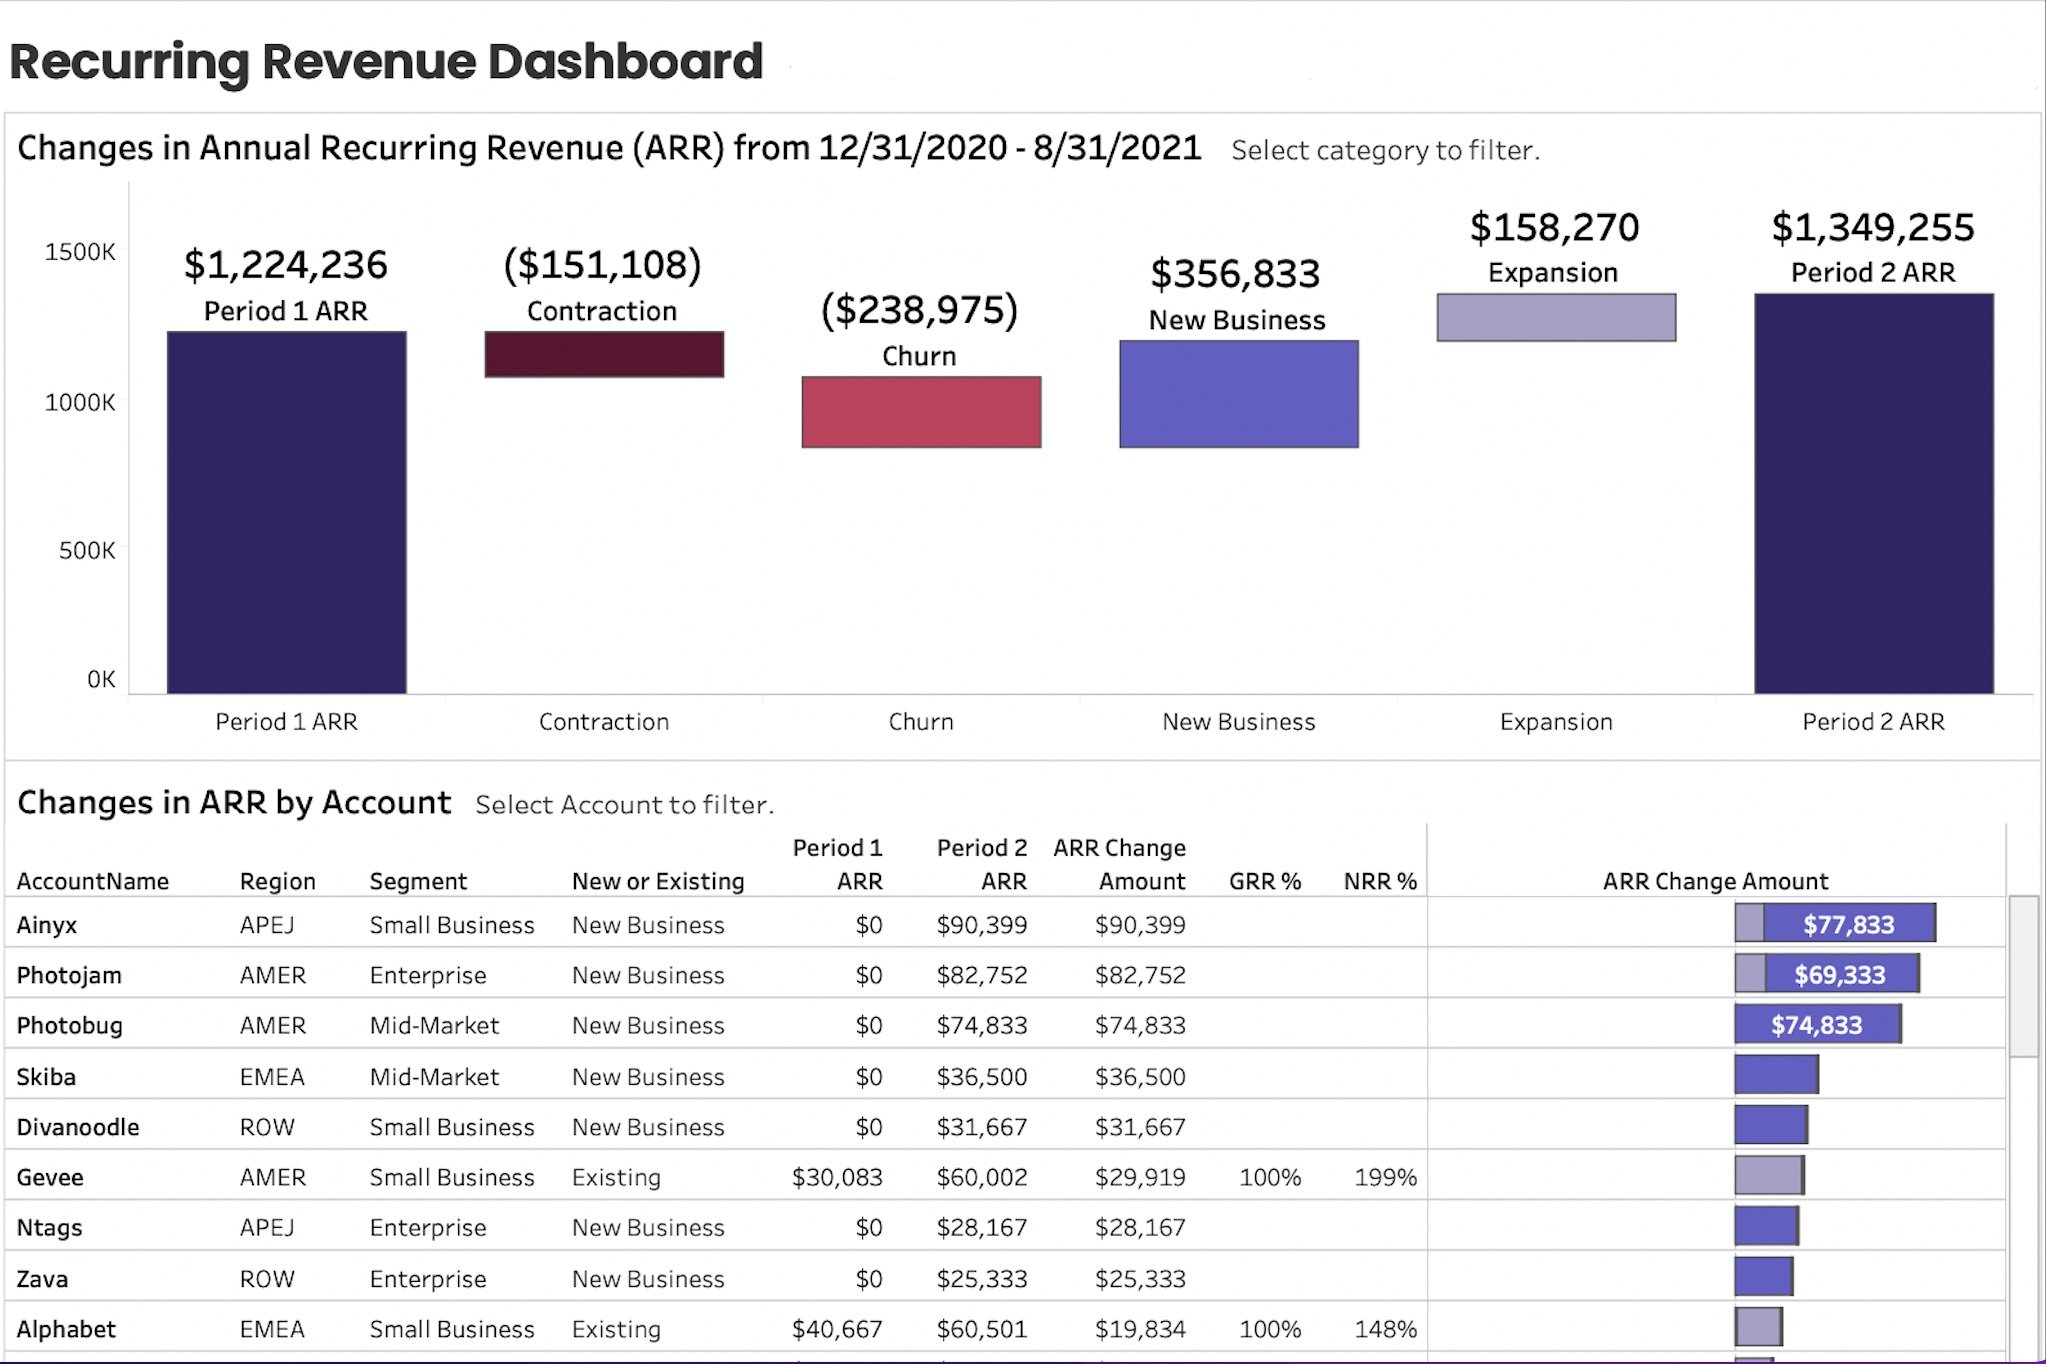
ARR Changes Dashboard
One of our most popular dashboard views, the ARR Waterfall Chart highlights changes in ARR over any selected period (new business, expansion, contraction, churn). This dashboard has the flexibility to view changes across categories or clients.
Customer Retention Dashboard
Easily evaluate retention trends over time with this customer success view. By tracking customer relationship-based metrics, this dashboard helps users find potential issues in retaining business and identify potential expansion opportunities at the customer level.
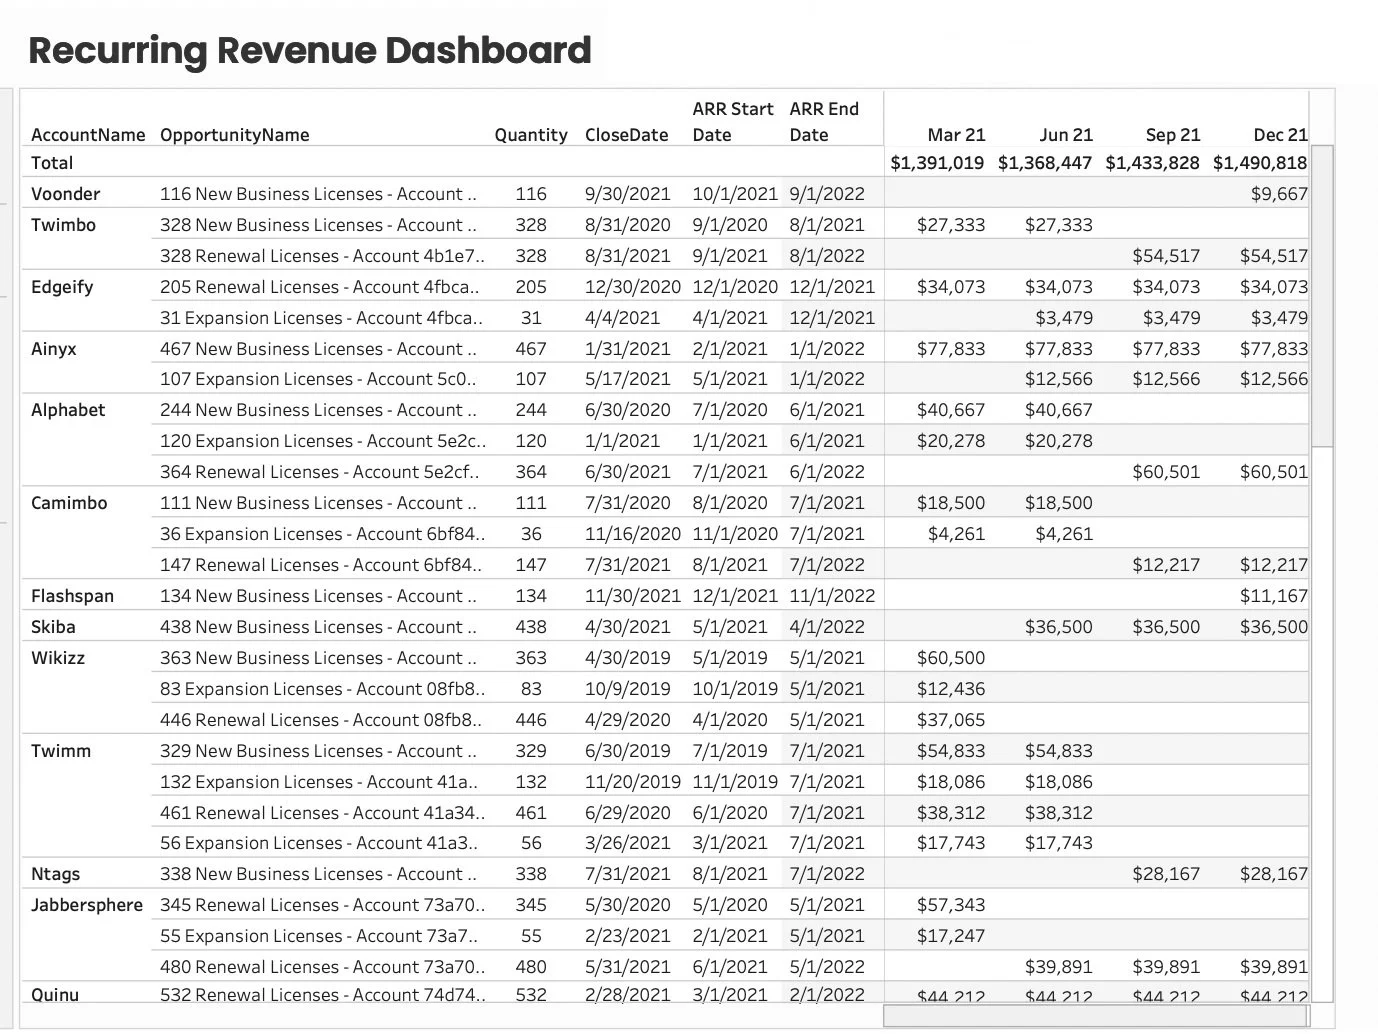
Customer Data
The fourth and final view is a comprehensive data table of all opportunities within your company, with the capability to filter by category. With the power of this data in the palm of your hand, you can easily perform any additional self-service analysis without any additional stress.
-
The Tableau Prep Workflow transforms your standard CRM data into three different data outputs that feed the Recurring Revenue Workbook with clean data and calculations.
• Calculates ARR, Term, Start and End Dates
• Links Opportunities to Renewals
• Creates rows to visualize trends
• Aggregates data to enable filterability
• Optimizes dashboard performance
• Saves your team countless hours of work (and headaches)!
-
You have the data, now what do you do with it?
The Workflow Implementation Documentation provides instruction to integrate the Tableau Prep Workflow into your existing systems and provides detailed descriptions of all calculations included in the Tableau Workflow and Dashboards.